
The concept of an organization that institutes a marquee business plan, guided by a mission that is distilled into goals, targets, and ultimately specific scopes of work, is not new. Successful schools and companies have mastered this concept, and many are seeing impressive results because of the initial planning and preparation that goes into the published plan. There is, however, an additional element of ongoing performance reviews woven into every great plan that might not be visible to an outsider’s eye. A disciplined approach to continual planning and preparation refines action, ensures optimal performance, and promotes real progress. We call for a process called R.E.P.S. to provide a model to monitor the fitness of any organization as they plan and prepare for future success.
So the question is simple: How fit is your organization?
To ensure overall fitness and performance, you must get in your R.E.P.S. In the world of fitness, according to livestrong.com, “reps” refers to the the number of repetitions, or times, you perform a particular exercise within a “set.” Sets refer to the number of times you repeat your reps. These reps are critical to achieving results, and strength is often determined by the number of reps you can do in a set using a given weight or even how much weight one can lift during each rep. As in fitness, organizations need to perform R.E.P.S. so that each area of focus is constantly reviewed for improved performance and so that progress is being made toward the goals.
We use R.E.P.S. as a simple model for reviewing progress to sustain success in ways that some organizations fail to do once some progress is made.
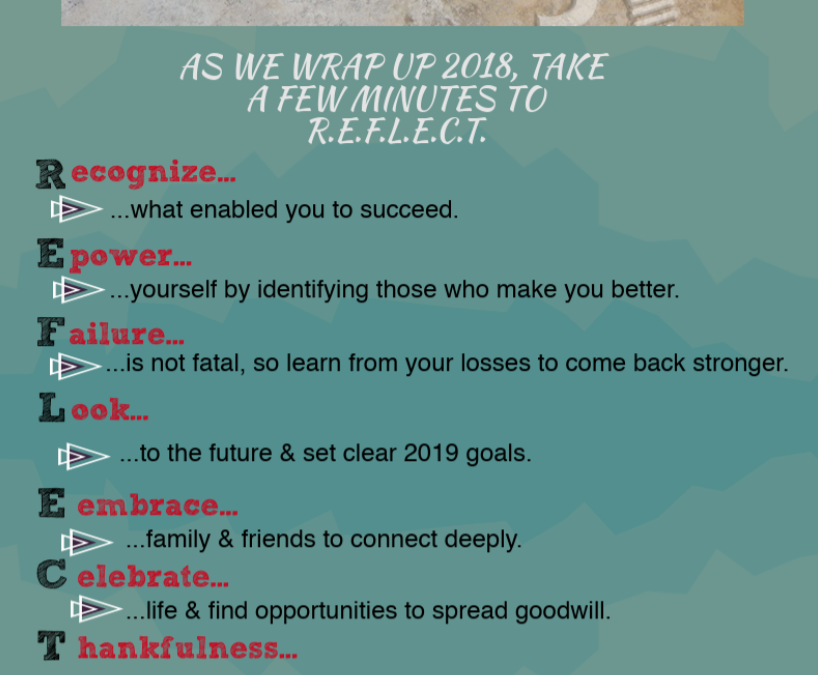
- Reflect
- Reflect on the work being done to determine successes and failures
- Evaluate
- Evaluate why the program or initiative is or is not successful
- Plan
- Plan to make the necessary adjustments
- Solidify
- Solidify the plan by taking specific actions
Too often, both successful and unsuccessful organizations move forward, doing the work, without getting in the necessary R.E.P.S. This is a costly mistake made by many leaders who make the deadly assumption that hard work and busyness will equate to improved performance and progress.
Leadership Assumption: Hard work and busyness will equate to improved performance and progress.
As Collins (2009) puts it, in his How the Mighty Fall, there are a variety of reasons why successful companies fall, but one of the early warning signs is when the what replaces the why and success is confused with activity and not insight. Keeping R.E.P.S. at the forefront prioritizes a constant review of the work and ensures that the why is always front-and-center.
So what does using R.E.P.S. look like in practice? Let’s meet Adam Lee.
This past school year Dr. Lee’s school district saw impressive gains district wide. Are they where they think they should be? No, but they are making progress through improved performance. Dr. Lee attributes some of their early success to a constant and incessant review of previously identified targets to ensure that they are on track. Dr. Lee’s district, a medium-sized urban district where he is the principal of the only high school, implemented a new literacy initiative that his district put into place in his school to improve student performance on pre-determined literacy assessments. The district knows that literacy is linked to college and career readiness. Everything that the district and school does comes back to vision, mission, core values, and the enumerated buckets where they put all of their attention for school improvement:
- Classroom Instruction
- Student Performance
- School Climate
The district knows that principals have a direct impact on these three areas, and they entrust Dr. Lee with the curriculum and resources provided to him to oversee success in these buckets. Dr. Lee employs the basic strategy of R.E.P.S. to each of the these three areas to monitor the school’s overall fitness. For example, in the bucket for student performance, you’ll find the literacy assessments where the district would like to see stronger gains, hence their new programming. The goal is to improve student performance on district common assessments and on the state’s assessment. By utilizing R.E.P.S., Dr. Lee, along with his team, reviews the success of the program throughout the year. Knowing the variety of factors involved in determining the success of a literacy program, R.E.P.S. ensures a thorough and ongoing analysis of what was working, what was not, and why. Dr. Lee knows that it’s far more than just prior planning that goes into real preparation and sustainability of programs like the one the district initiated.
This past year, each marking period, the team reflected on how well the program was being implemented as well as how well the program was being received by those involved. The data gleaned from the program was evaluated and discussed. If necessary, adjustments were made to the original plan and the scope of work. And, the changes were solidified with specific actions. This means that they did four sets using R.E.P.S. as their model for each. The results were simple: Dr. Lee knew throughout the year if the literacy program was making a difference and the impact it was having on his students and staff. They reflected, evaluated, planned, and solidified. They knew from the onset that planning and preparing is not enough if it’s only done prior to initiating something new and not as an ongoing aspect of sustaining the initiative.
Planning and preparing is not a one-time deal. Rather, it’s an ongoing discipline to ensure that improved performance and progress toward goals are being made. R.E.P.S. provides organizations with a simple model and strategy so that key targets are being measured and met. That’s how great organizations stay fit.
TheSchoolHouse302 is about getting to simple and maximizing effective research-based strategies that empower individuals to lead better and grow faster.
Let us know what you think of this #SH302 post with a like, follow, or comment.
Joe & T.J.
Collins, J. (2009). How the mighty fall: And why some companies never give in. New York: Collins Business.

 As always, please like, follow, and comment. If you have topics of interest, guests you want us to interview, or books that we should read and recommend, please let us know that as well.
Joe & T.J.
As always, please like, follow, and comment. If you have topics of interest, guests you want us to interview, or books that we should read and recommend, please let us know that as well.
Joe & T.J.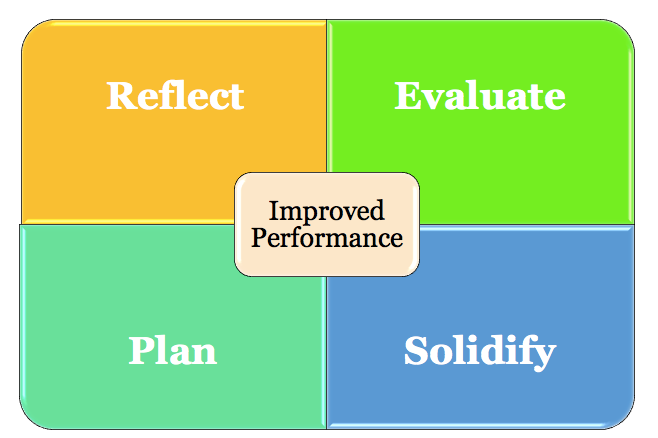

 7 Mindshifts for School Leaders: Finding New Ways to Think About Old Problems.


