
This month has been all about data at TheSchoolHouse302.com. We posted 3 ideas for ensuring that data is actionable in your organization, and we focused on unconventional data sources, using data to tell a story, and taking steps to ensure that data means strategic action.
We welcomed Dr. Liz Farley-Ripple, Associate Professor in the School of Education at the University of Delaware, to our #onethingseries. If you haven’t heard the podcast, listen here. In less than 10 minutes, you’ll get awesome and practical recommendations for using data.
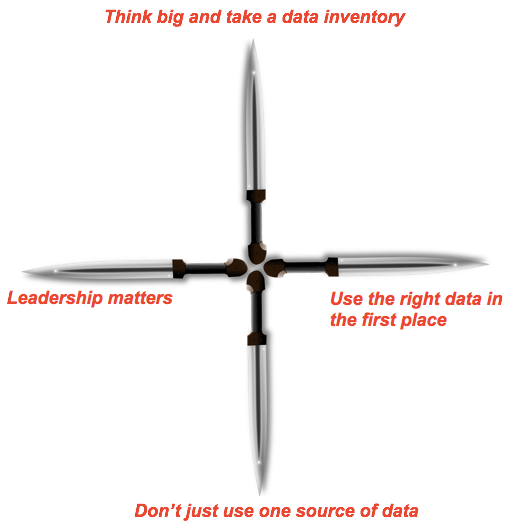
At TheSchoolHouse302, we are always “getting to simple” so leaders can grow and learn. Leadership is about taking action to make improvements to our environments, and using data is one tool that all great leaders use to improve their organization. As great leaders develop, though, they often grow accustom to making quick decisions based on intuition. Malcolm Gladwell calls this “the power of thinking without thinking.” In his book Blink, he describes a reality where some people can make quick decisions in complex scenarios where others simply can’t. But Victoria Bernhardt tells readers that quick decision-making is not the best route, especially in schools where we should be working to “replace hunches and hypotheses with facts concerning what changes are needed.” After all, using data to inform decisions is really a strategy about determining what actions to take to influence change. Here are the four most important strategies to consider when using data to make a change in your organization. We call them “data daggers” because they’re meant to pierce a target and penetrate your organization to produce just the right results for positive change to occur.
The Four Daggers for Data Decision-making
Dagger #1: Think big and take a data inventory. There are far more data sources than we often acknowledge. Dr. Farley-Ripple talks about an inventory exercise that you can do with your team where you might start with 5 or 6 typical data sources and then expand to up to 150 data points. Although that’s too many to use, the inventory helps us to recognize that we can get “stuck” in our paradigm and we have access to more data and information than we realize. Once you go big, you can scale back to the most important metrics, hopefully new sources that use data as a flashlight rather than a hammer. This takes us right to our next dagger.
Consideration: Switch the target from a narrow view of typical data sources to a broader scope of available data.
Dagger #2: Use the right data in the first place. With a proper data inventory, we can identify new and often unconventional data sources. As Dr. Farley-Ripple pointed out, most data fall into four categories: process data, performance data, demographic data, and perception data. Schools are great at using performance data and even demographic data, but these commonplace sources can only drive change so far. Let’s ask different questions about outcomes to reach new heights. Instead of asking how students are performing on assessments, we might ask how they feel about their experiences with a certain subject. This switches instrumentation from a test to a survey and should prompt new and important conversations about the story that data can tell us if we listen to the right sources of information.
Consideration: Switch the target from performance and demographic data to process and perception data.
Dagger #3: Don’t just use one source of data. Situations are complex but they don’t have to be complicated. Let data tell a story over time rather than looking at one source of data after the story has been told. This means that data collection has to be a process rather than a product. When we look at data, we should see trends and themes and not just singular points. When your team presents a number to represent one point in time, challenge any assumption you might make with that cross-sectional reference by using more of a longitudinal approach. Singular sources of data can lead to quick and false conclusions. Prevent your team from using single sources of data after the fact and look for trends at checkpoints along the way.
Consideration: Switch the target from singular outcome data points to trend and thematic analyses.
Dagger #4: Leadership matters. Turn data into action with leadership. As leaders, we have to model data usage using the first three daggers as our guide. We can’t expect others to think big, think differently, or uncover a trend if we don’t explicitly and consistently demonstrate that as the leader. Leadership also means handing over the data daggers to one or more of the team members who might be best suited for hitting the target. Let members of the team present their data stories using new data sources rather than doing all the data digging yourself. At the heart of great data conversations is a team of people working together to drive change. The leader can’t stand alone, drowning in all of the names and numbers.
Consideration: Switch the target from an individual approach to a teamwork approach by modeling the way.
We hope you find value in using these four data daggers for decision-making in your school or organization. Using data might be complex but it doesn’t have to be complicated.
TheSchoolHouse302 is about getting to simple and maximizing effective research-based strategies that empower individuals to lead better and grow faster.
We value your comments, likes, and follows.
Bernhardt, V. (2004). Data analysis for continuous school improvement. Larchmont, NY: Eye on Education.
Gladwell, M. (2005). Blink. New York: Little Brown and Company


0 Comments